Diagramming
During the process of lo-fidelity wireframing, it’s essential not only to sketch screens but also to create diagrams such as information architecture and user flows. Frame0 supports the creation of various types of diagrams beyond just screen sketches, offering flexibility for comprehensive design work.
Flowchart
Section titled “Flowchart”Flowchart is a diagram that visually represents a process or workflow using symbols and arrows to show steps and decisions.
To draw a flowchart, select the Flowchart category in the Shapes View to display only flowchart elements, then drag and drop them onto the canvas.

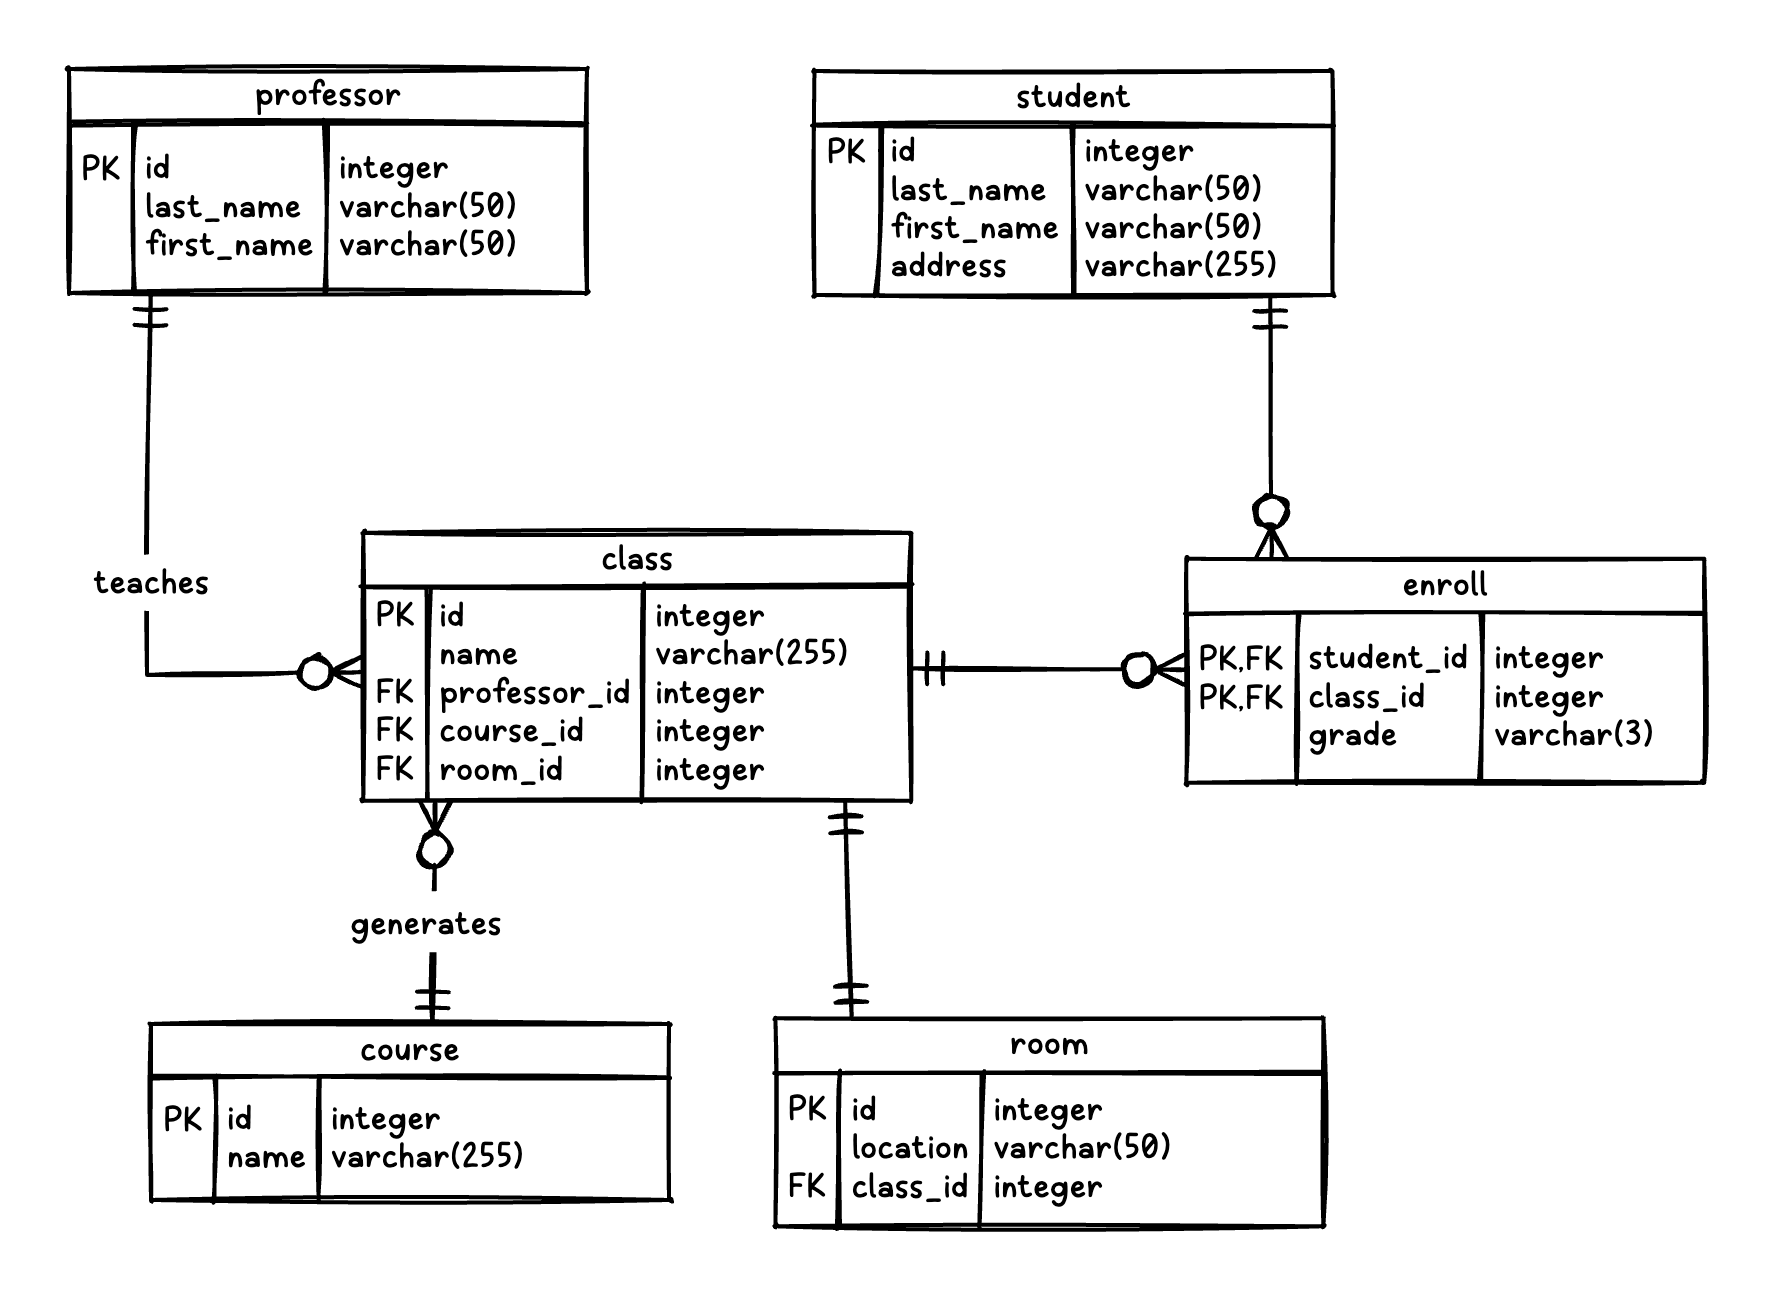
ERD (Entity-Relationship Diagram)
Section titled “ERD (Entity-Relationship Diagram)”ERD is a diagram that shows the structure of a database by illustrating entities, their attributes, and relationships.
To draw a ERD, select the ERD category in the Shapes View to display only ERD elements, then drag and drop them onto the canvas.

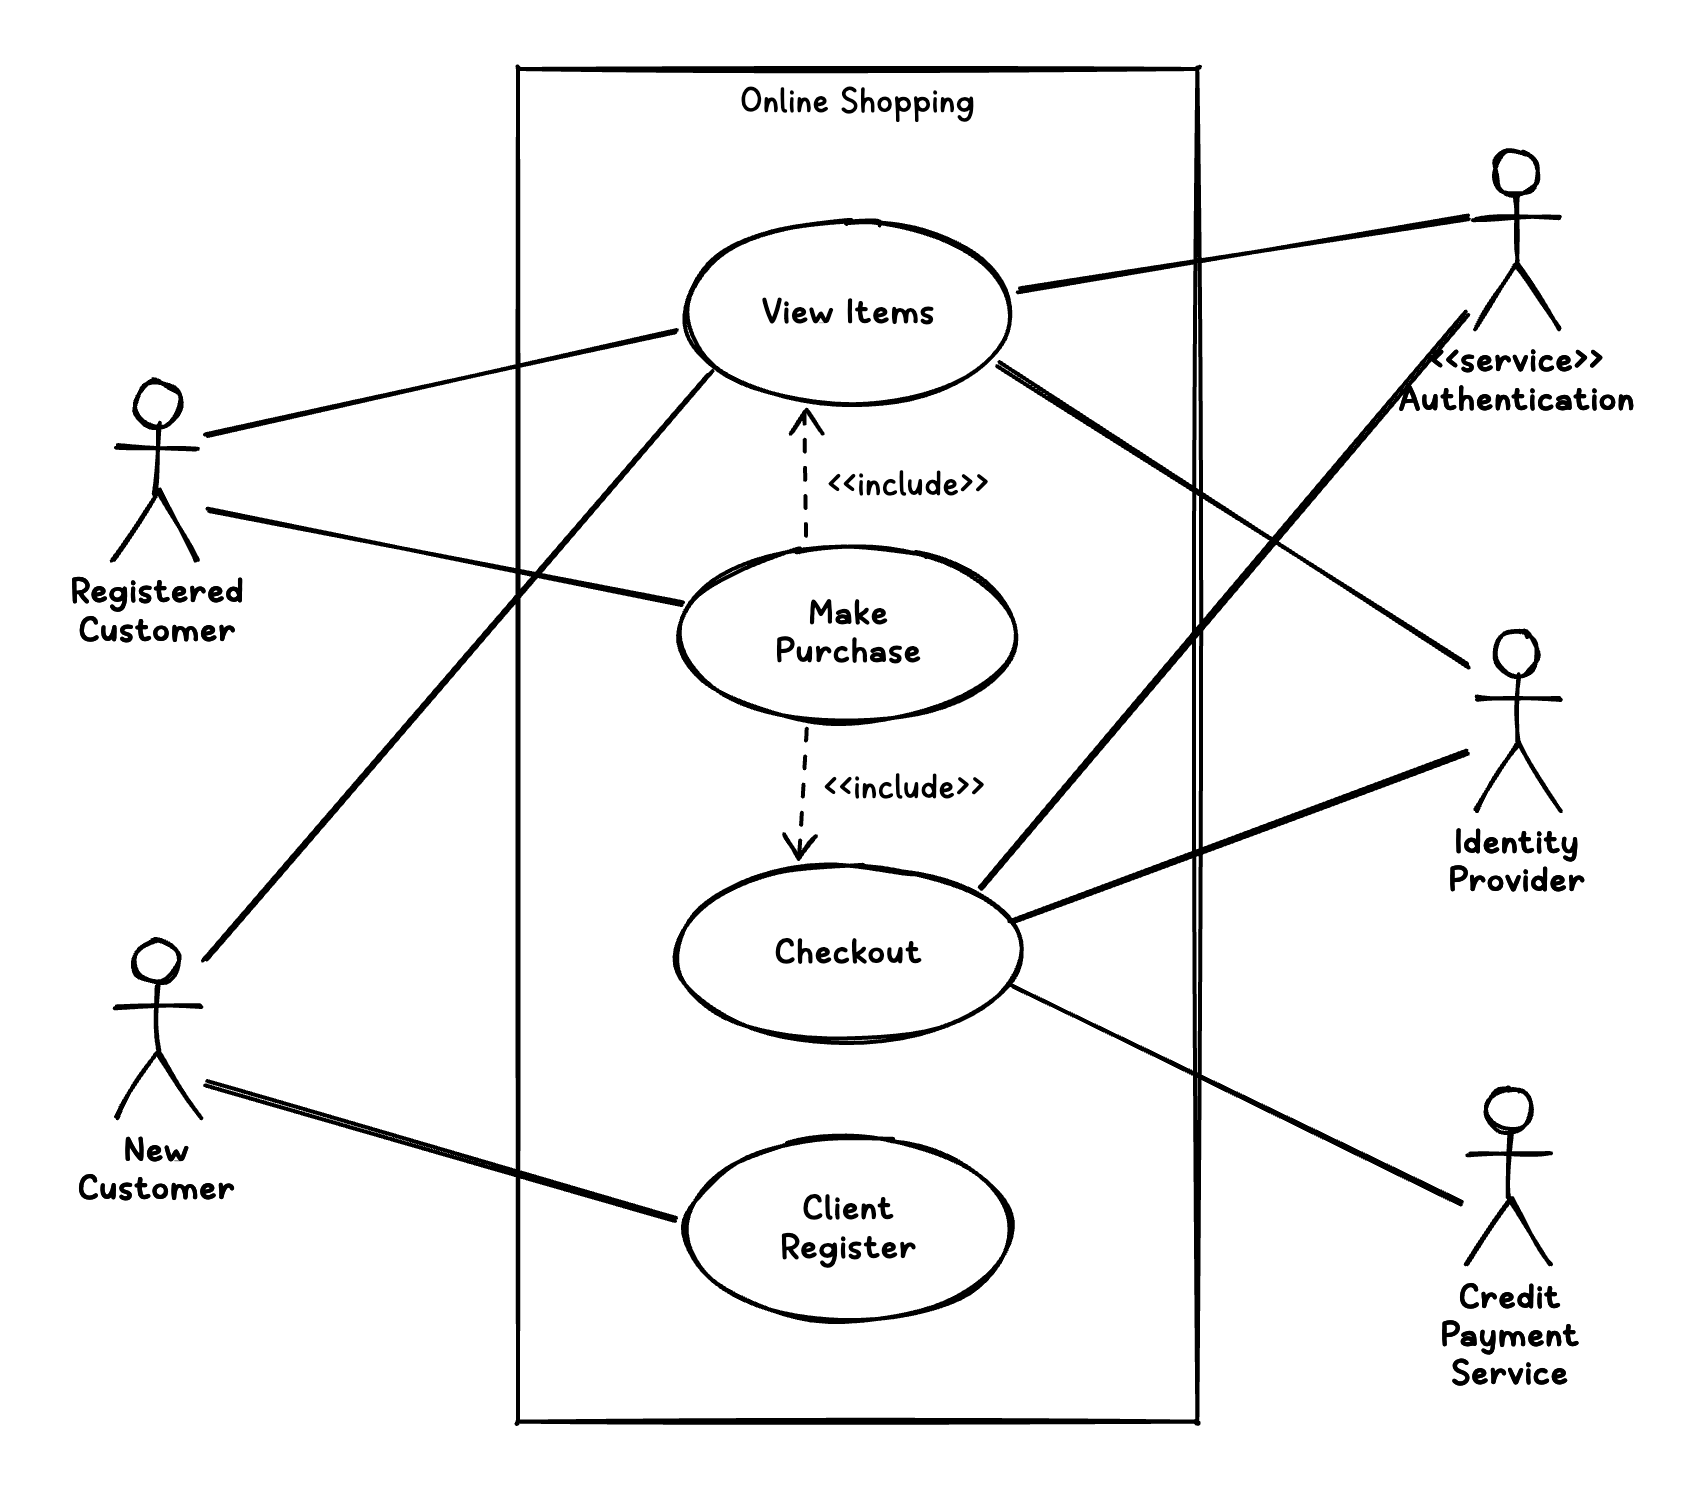
UML Use Case Diagram
Section titled “UML Use Case Diagram”UML Use Case Diagram is a diagram that depicts the interactions between users and a system, focusing on goals and functionalities.
To draw a UML Use Case Diagram, select the UML Use Case category in the Shapes View to display only UML Use Case elements, then drag and drop them onto the canvas.

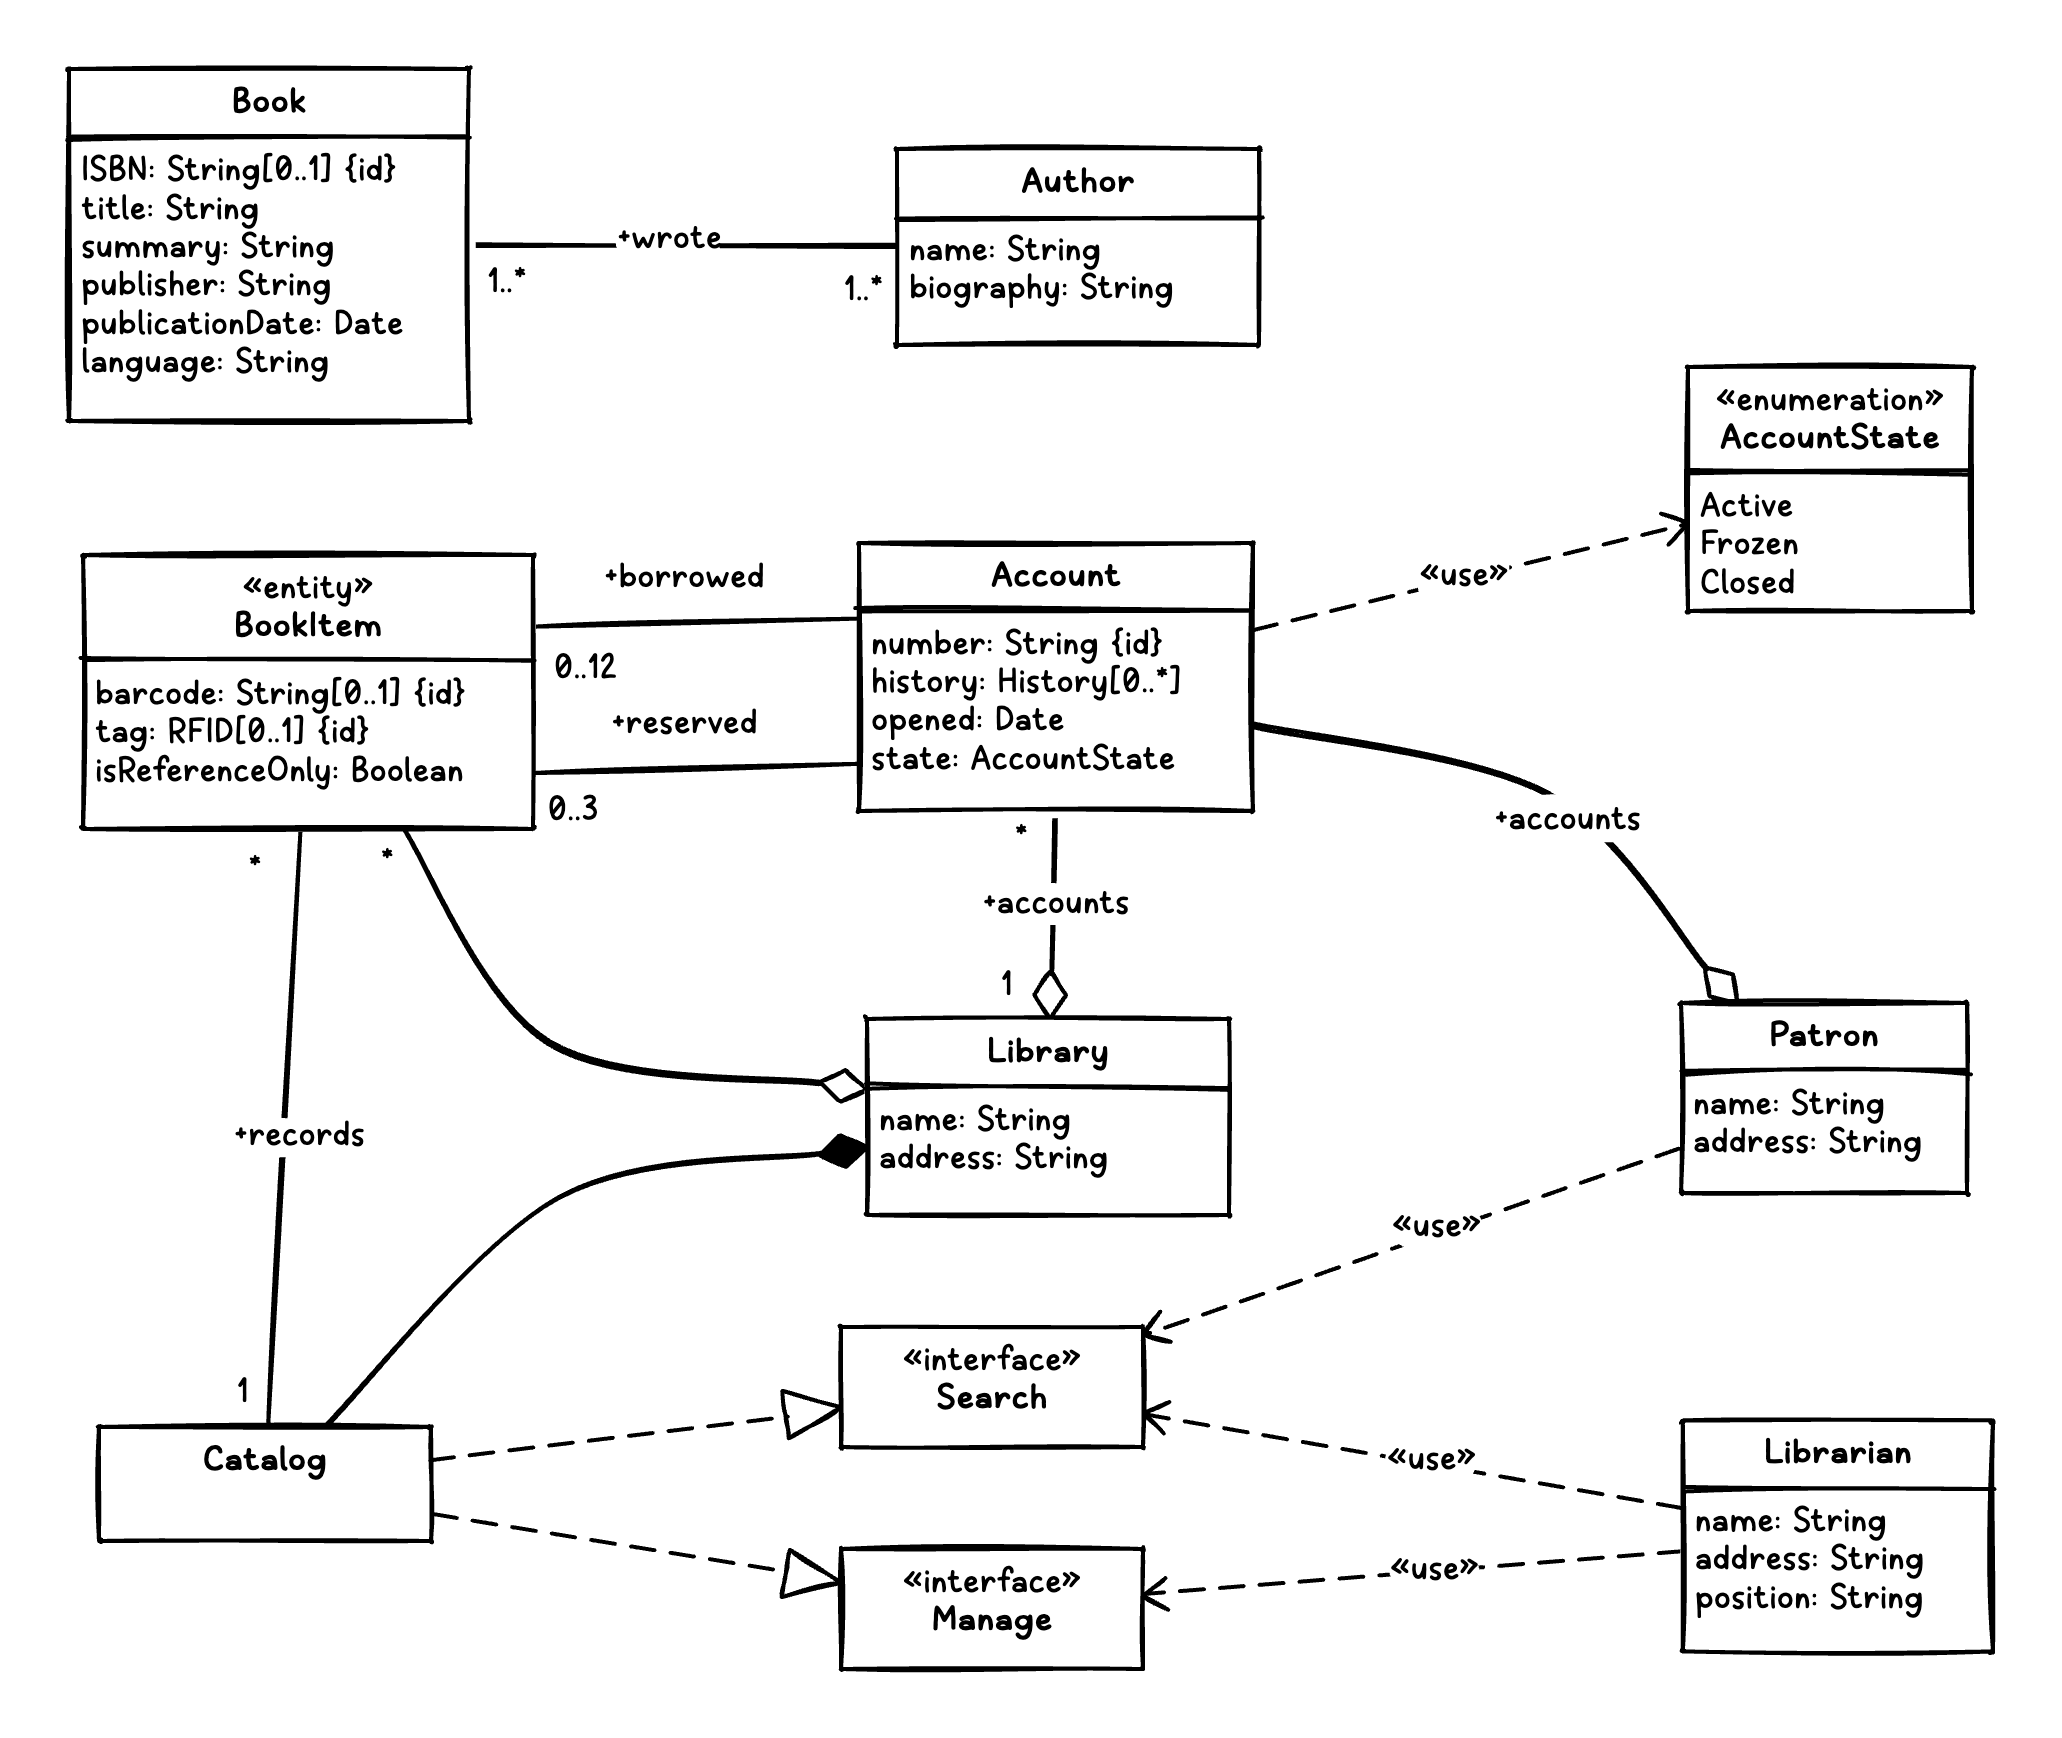
UML Class Diagram
Section titled “UML Class Diagram”UML Class Diagram is a diagram that represents the structure of a system by showing its classes, attributes, methods, and relationships.
To draw a UML Class Diagram, select the UML Class category in the Shapes View to display only UML Class elements, then drag and drop them onto the canvas.

